Blog
How to Read a Copy-Trading Leaderboard
copy-tradingbybitmetrics
When you land on a copy-trading leaderboard like Bybit’s, you are flooded with percentages, charts, and metrics. It is easy to get distracted by the biggest, greenest numbers.
But looking only at raw returns is the fastest way to blow up your account. To find a stable, long-term strategy, you need to know how to read the full picture.
Here is a guide to the key metrics you see on a leaderboard profile and how to weigh them like a professional.
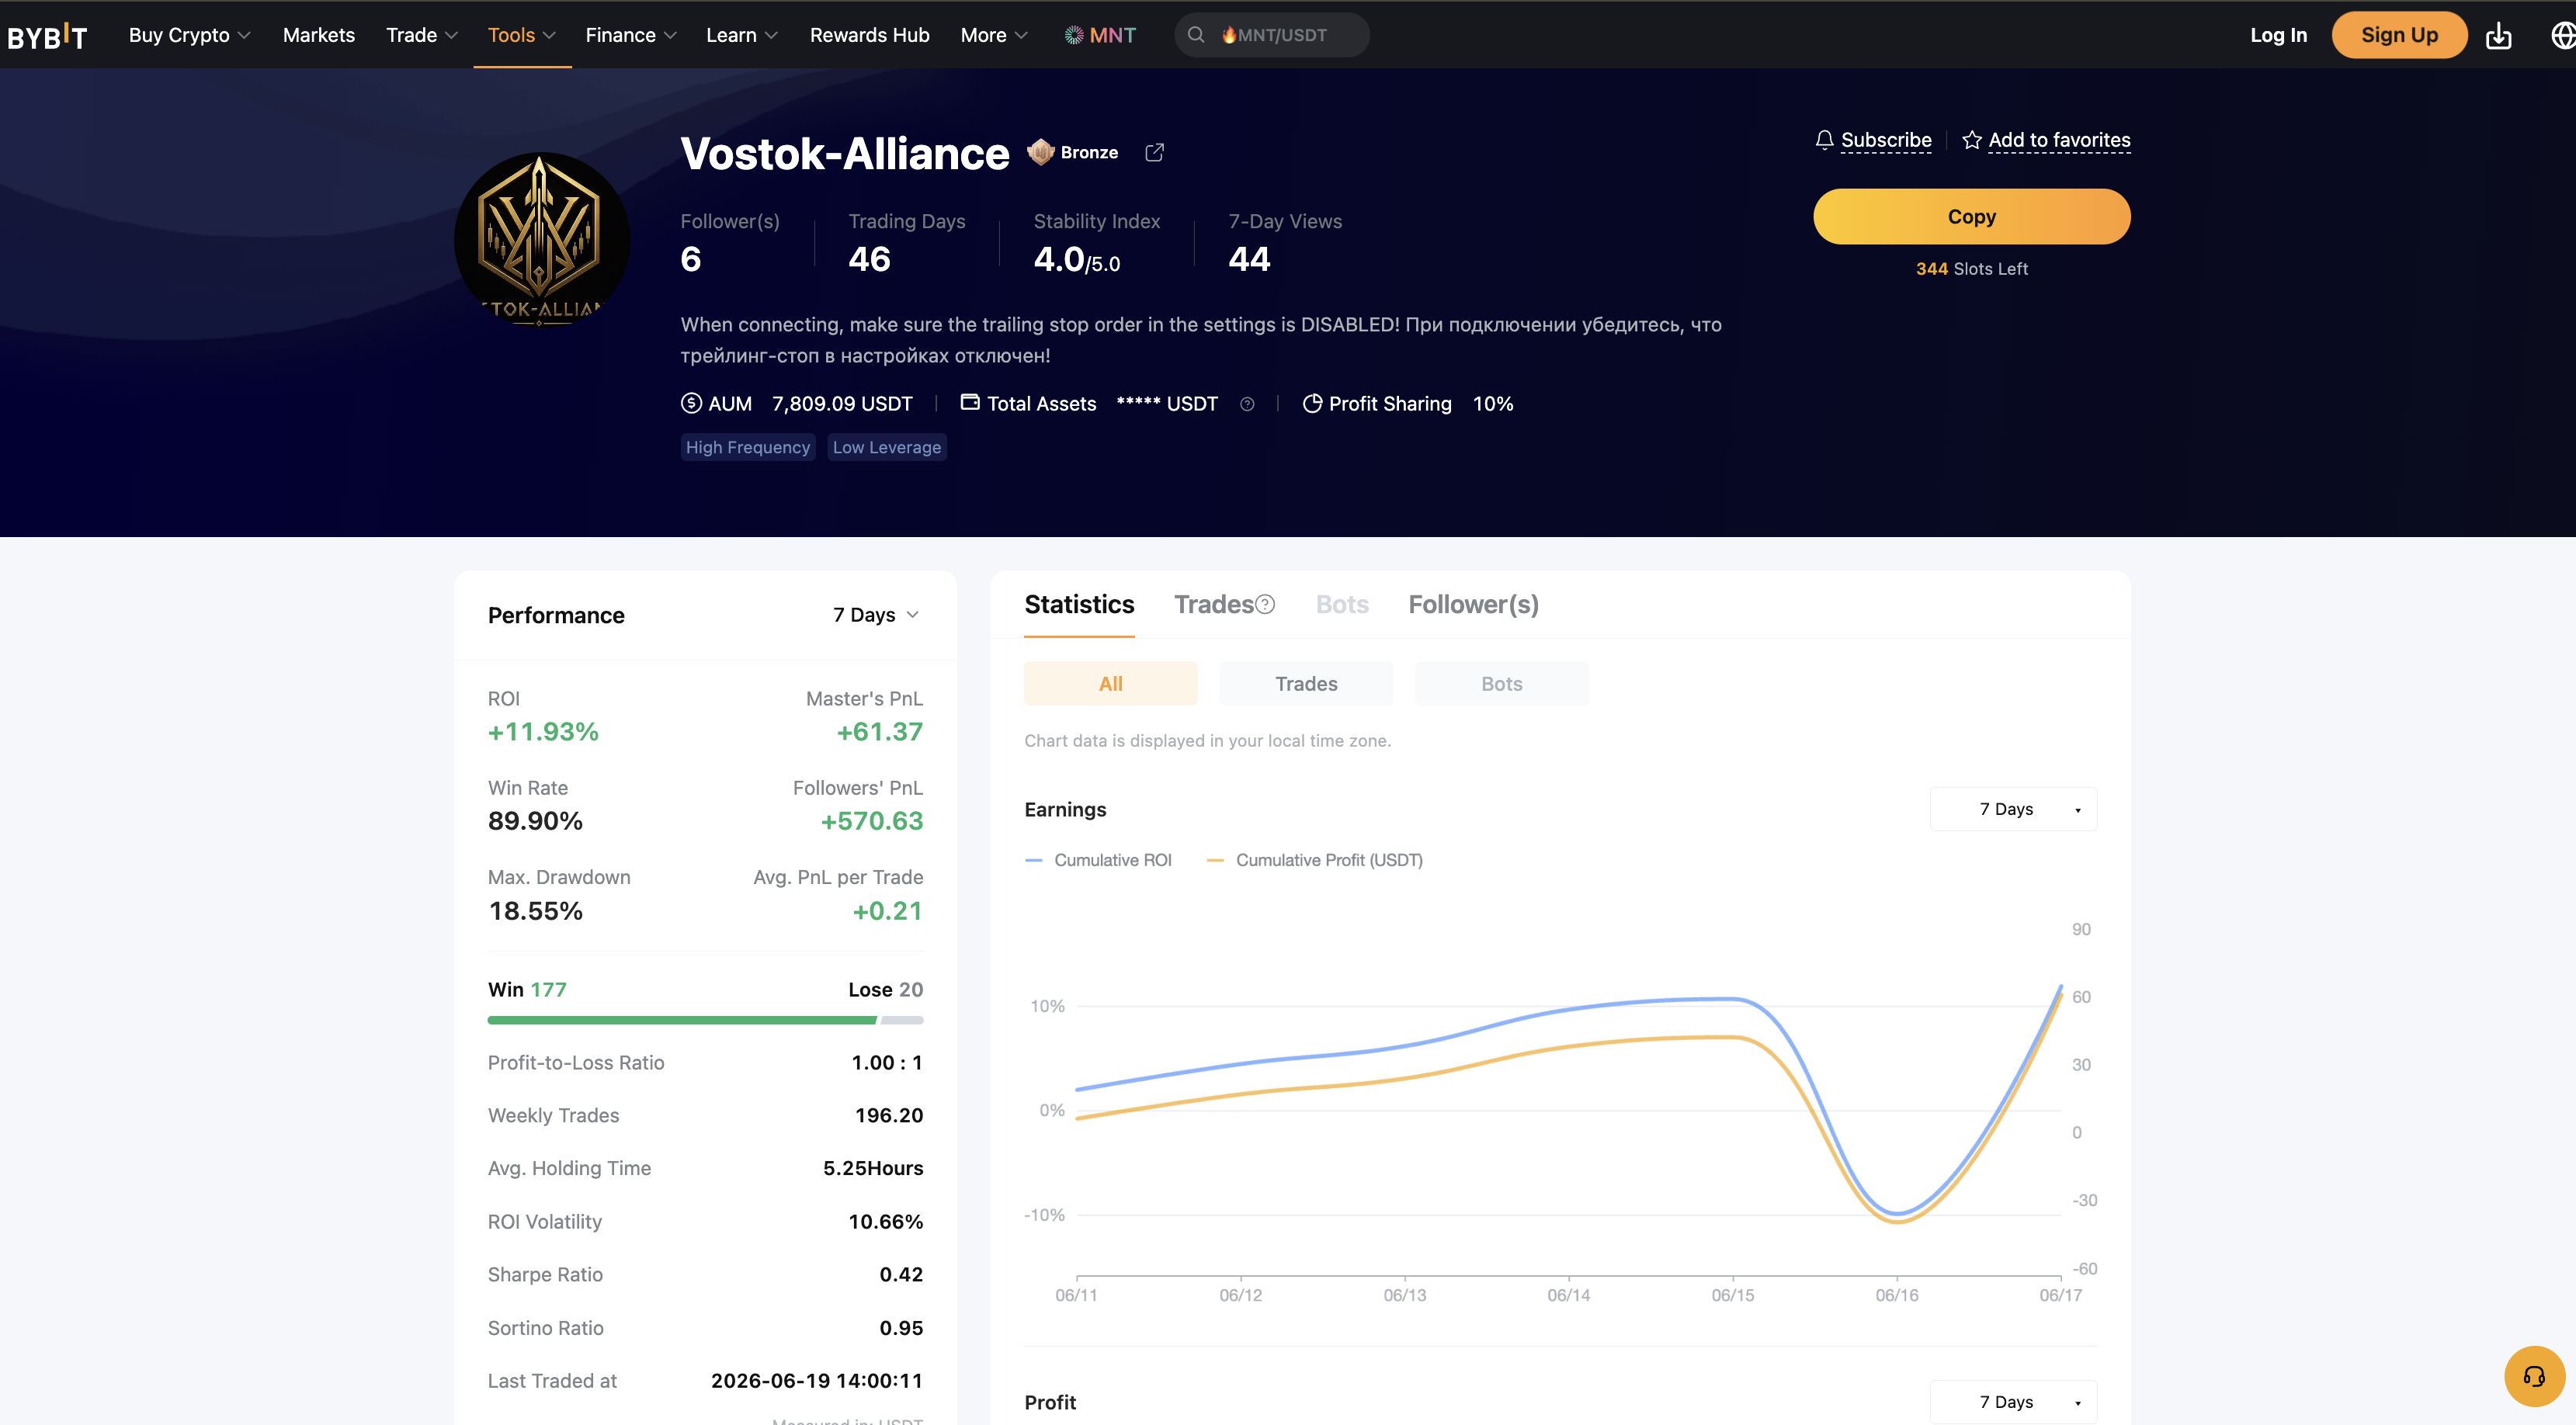
An overview of our Bybit copy-trading profile. You can check the live numbers on our verified Bybit profile.
1. ROI (Return on Investment)
ROI is the first thing everyone looks at, but it is often the most misleading.
On Bybit, you can filter ROI by 7, 30, or 90 days. A trader showing a +200% ROI over 7 days might look like a genius, but they are likely using extreme leverage on a lucky streak. That level of risk is unsustainable; they could easily lose it all next week.
Look for a consistent ROI over a longer period (like 30 or 90 days) combined with a healthy number of trading days. For example, our own verified Bybit profile shows active trading across 46 days, which gives a much clearer picture of performance than a single lucky week.
2. Max Drawdown (The true risk metric)
If you only look at one metric other than return, make it Max Drawdown.
Drawdown is the maximum peak-to-valley loss an account has experienced. If a trader has a 100% return but a 50% max drawdown, it means their followers had to sit through a period where their account value cut in half.
Professional managers focus on protecting downside first. A strategy with moderate returns and a controlled drawdown (such as under 20%) is far safer than a high-return strategy that takes wild risks. Check the drawdown percentage on any profile before you hit copy.
3. Win Rate and the P/L Ratio
A high win rate sounds great. A trader showing a 95% win rate seems bulletproof.
However, win rate alone is meaningless. If a trader wins 95 times out of 100 to make $1 each time, but loses $200 on the other 5 trades, they are losing money overall. This is common with grid or martingale strategies that refuse to cut losses.
Look at the P/L Ratio (average profit per winning trade vs. average loss per losing trade) alongside the win rate. A balanced strategy keeps its average losses small and comparable to its average wins, rather than letting single bad trades wipe out weeks of gains.
4. Sharpe and Sortino Ratios
These are risk-adjusted performance metrics. They tell you how much return a strategy generates for the amount of volatility it takes.
- Sharpe Ratio: Measures return relative to total volatility.
- Sortino Ratio: A variation of Sharpe that only penalizes downward price moves.
A Sortino ratio above 1.0 is generally considered very good, showing that the trader’s volatility is mostly on the upside (winning trades) rather than dangerous drops.
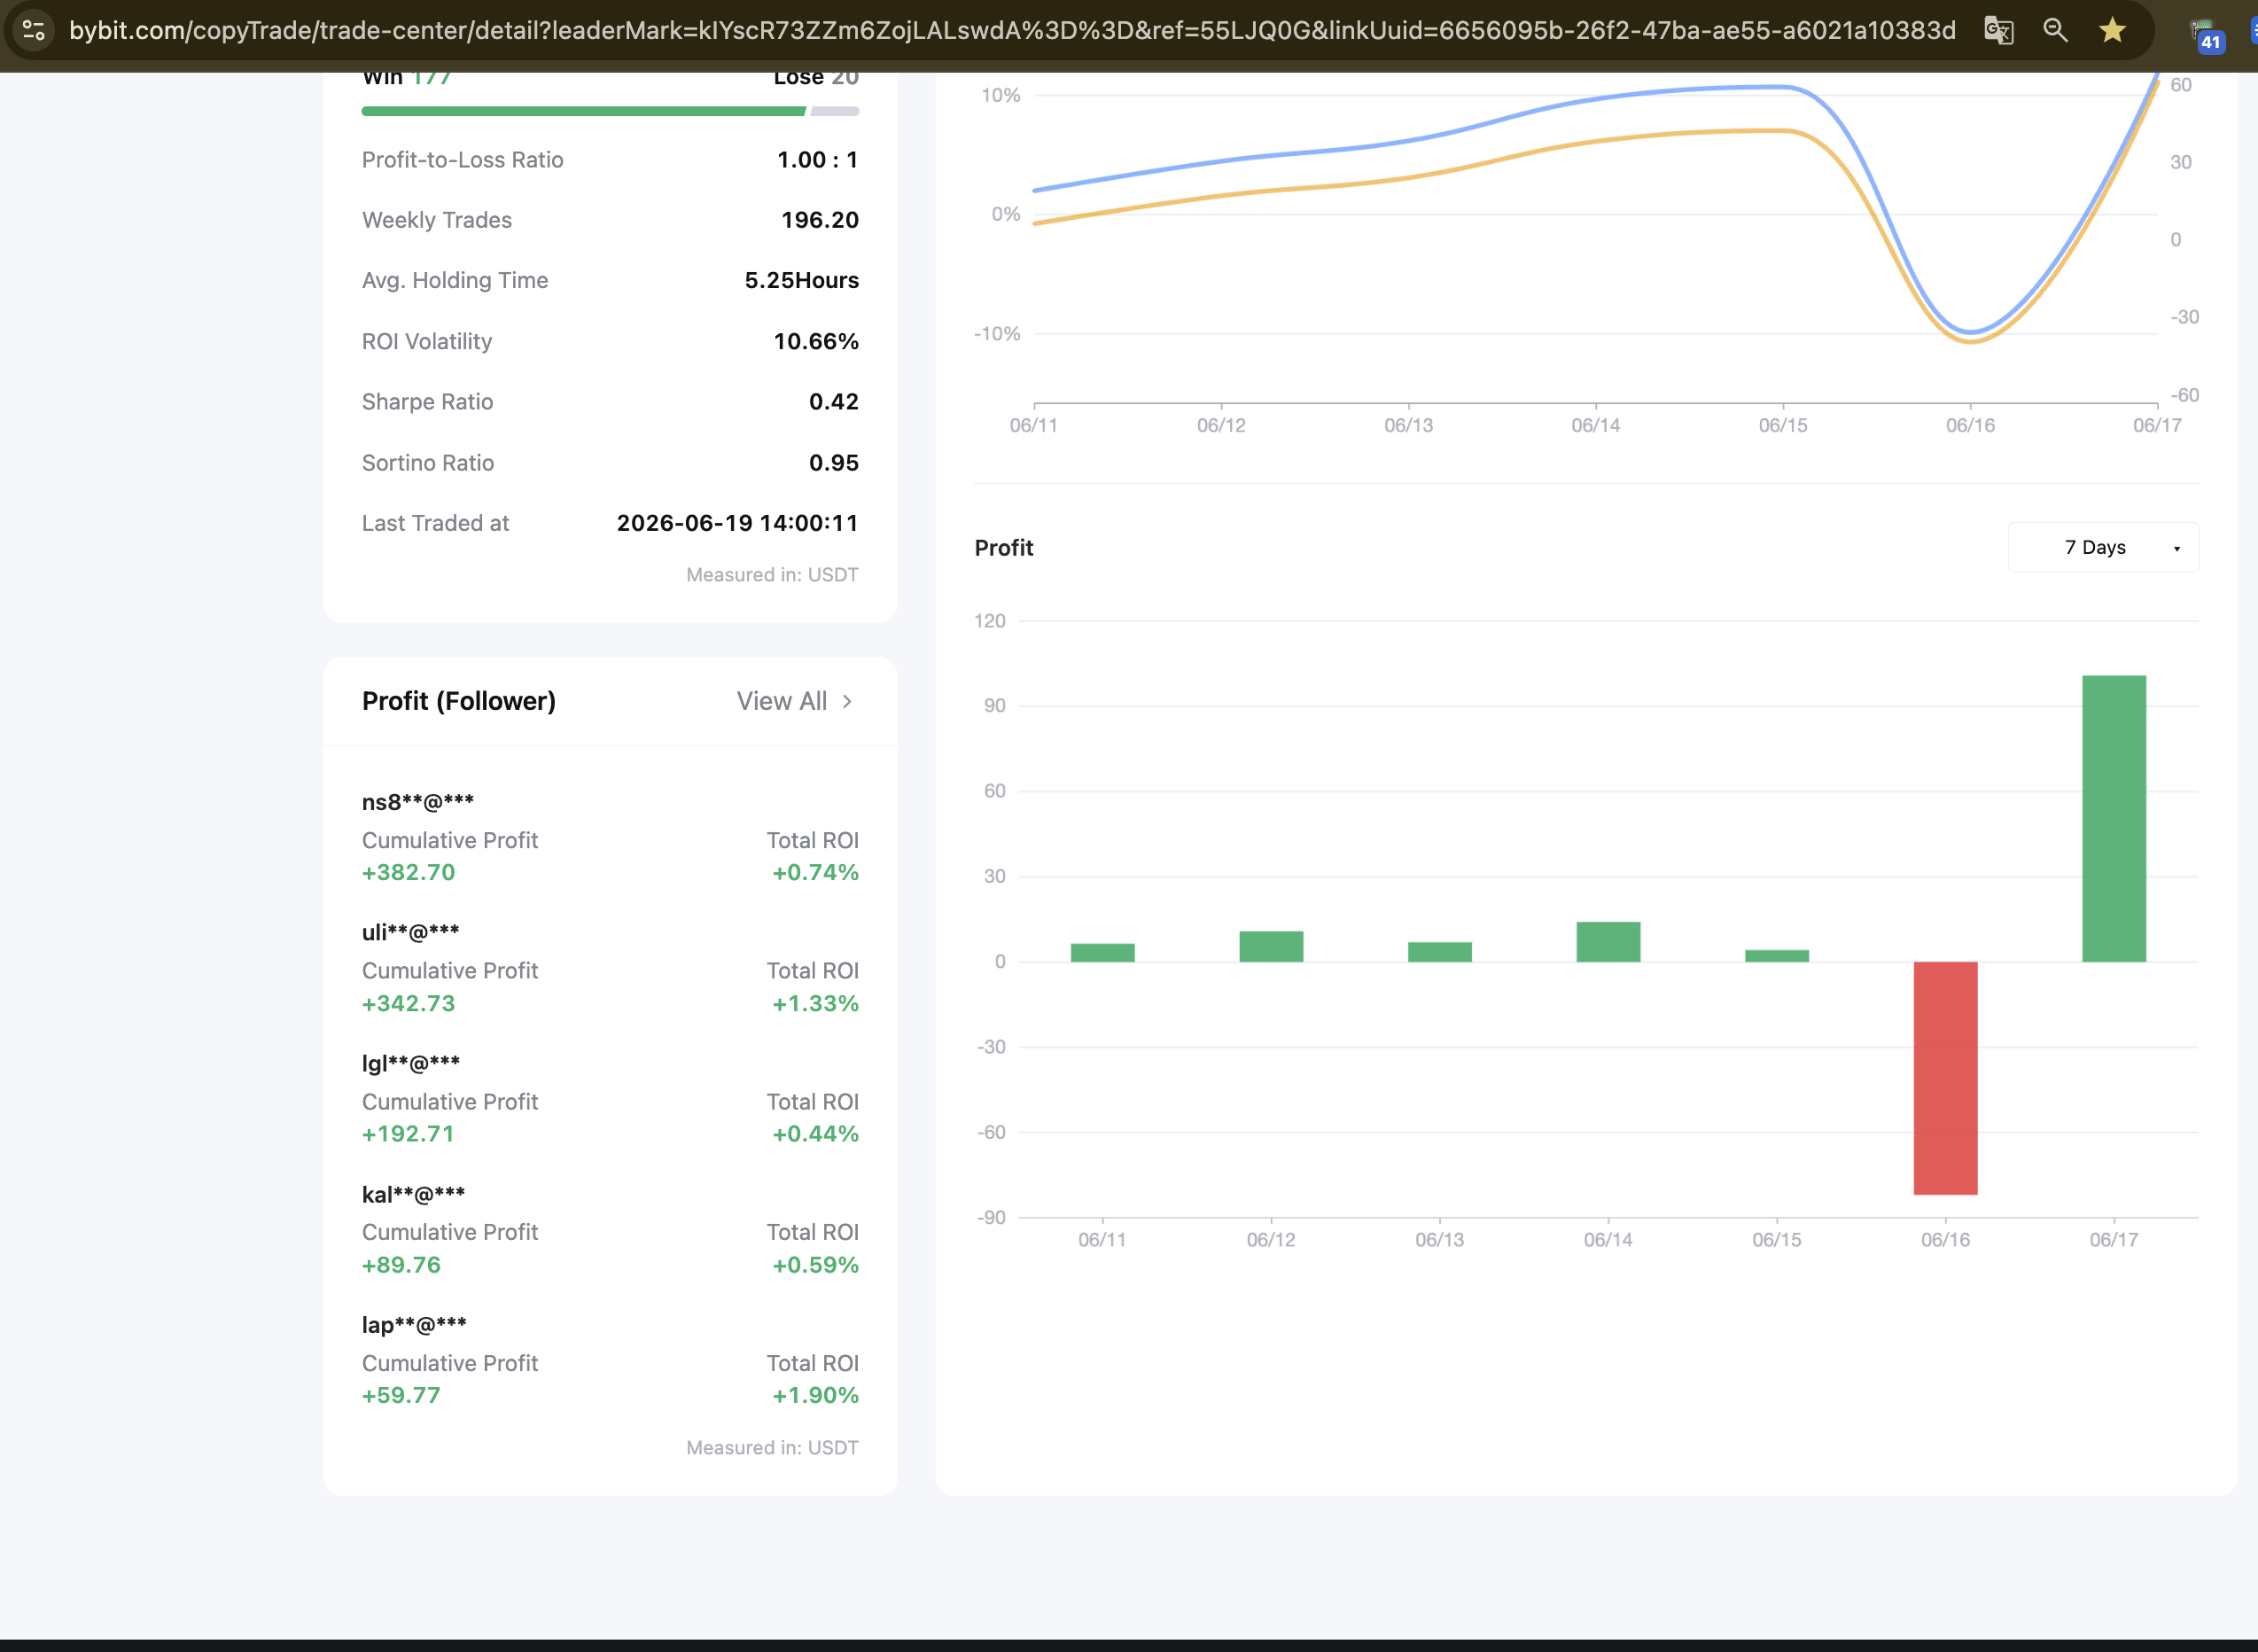
Detailed performance metrics and follower profit breakdown on our Bybit profile.
5. AUM and Followers
Assets Under Management (AUM) shows the total value of copier funds following the trader.
A higher AUM shows that other investors trust the account, but it also changes execution. As AUM grows, entering and exiting large positions can cause slippage. A strategy needs to be built to handle size. Our profile currently manages over $7,800 in AUM, showing stable scaling with our automated impulse-scalping approach.
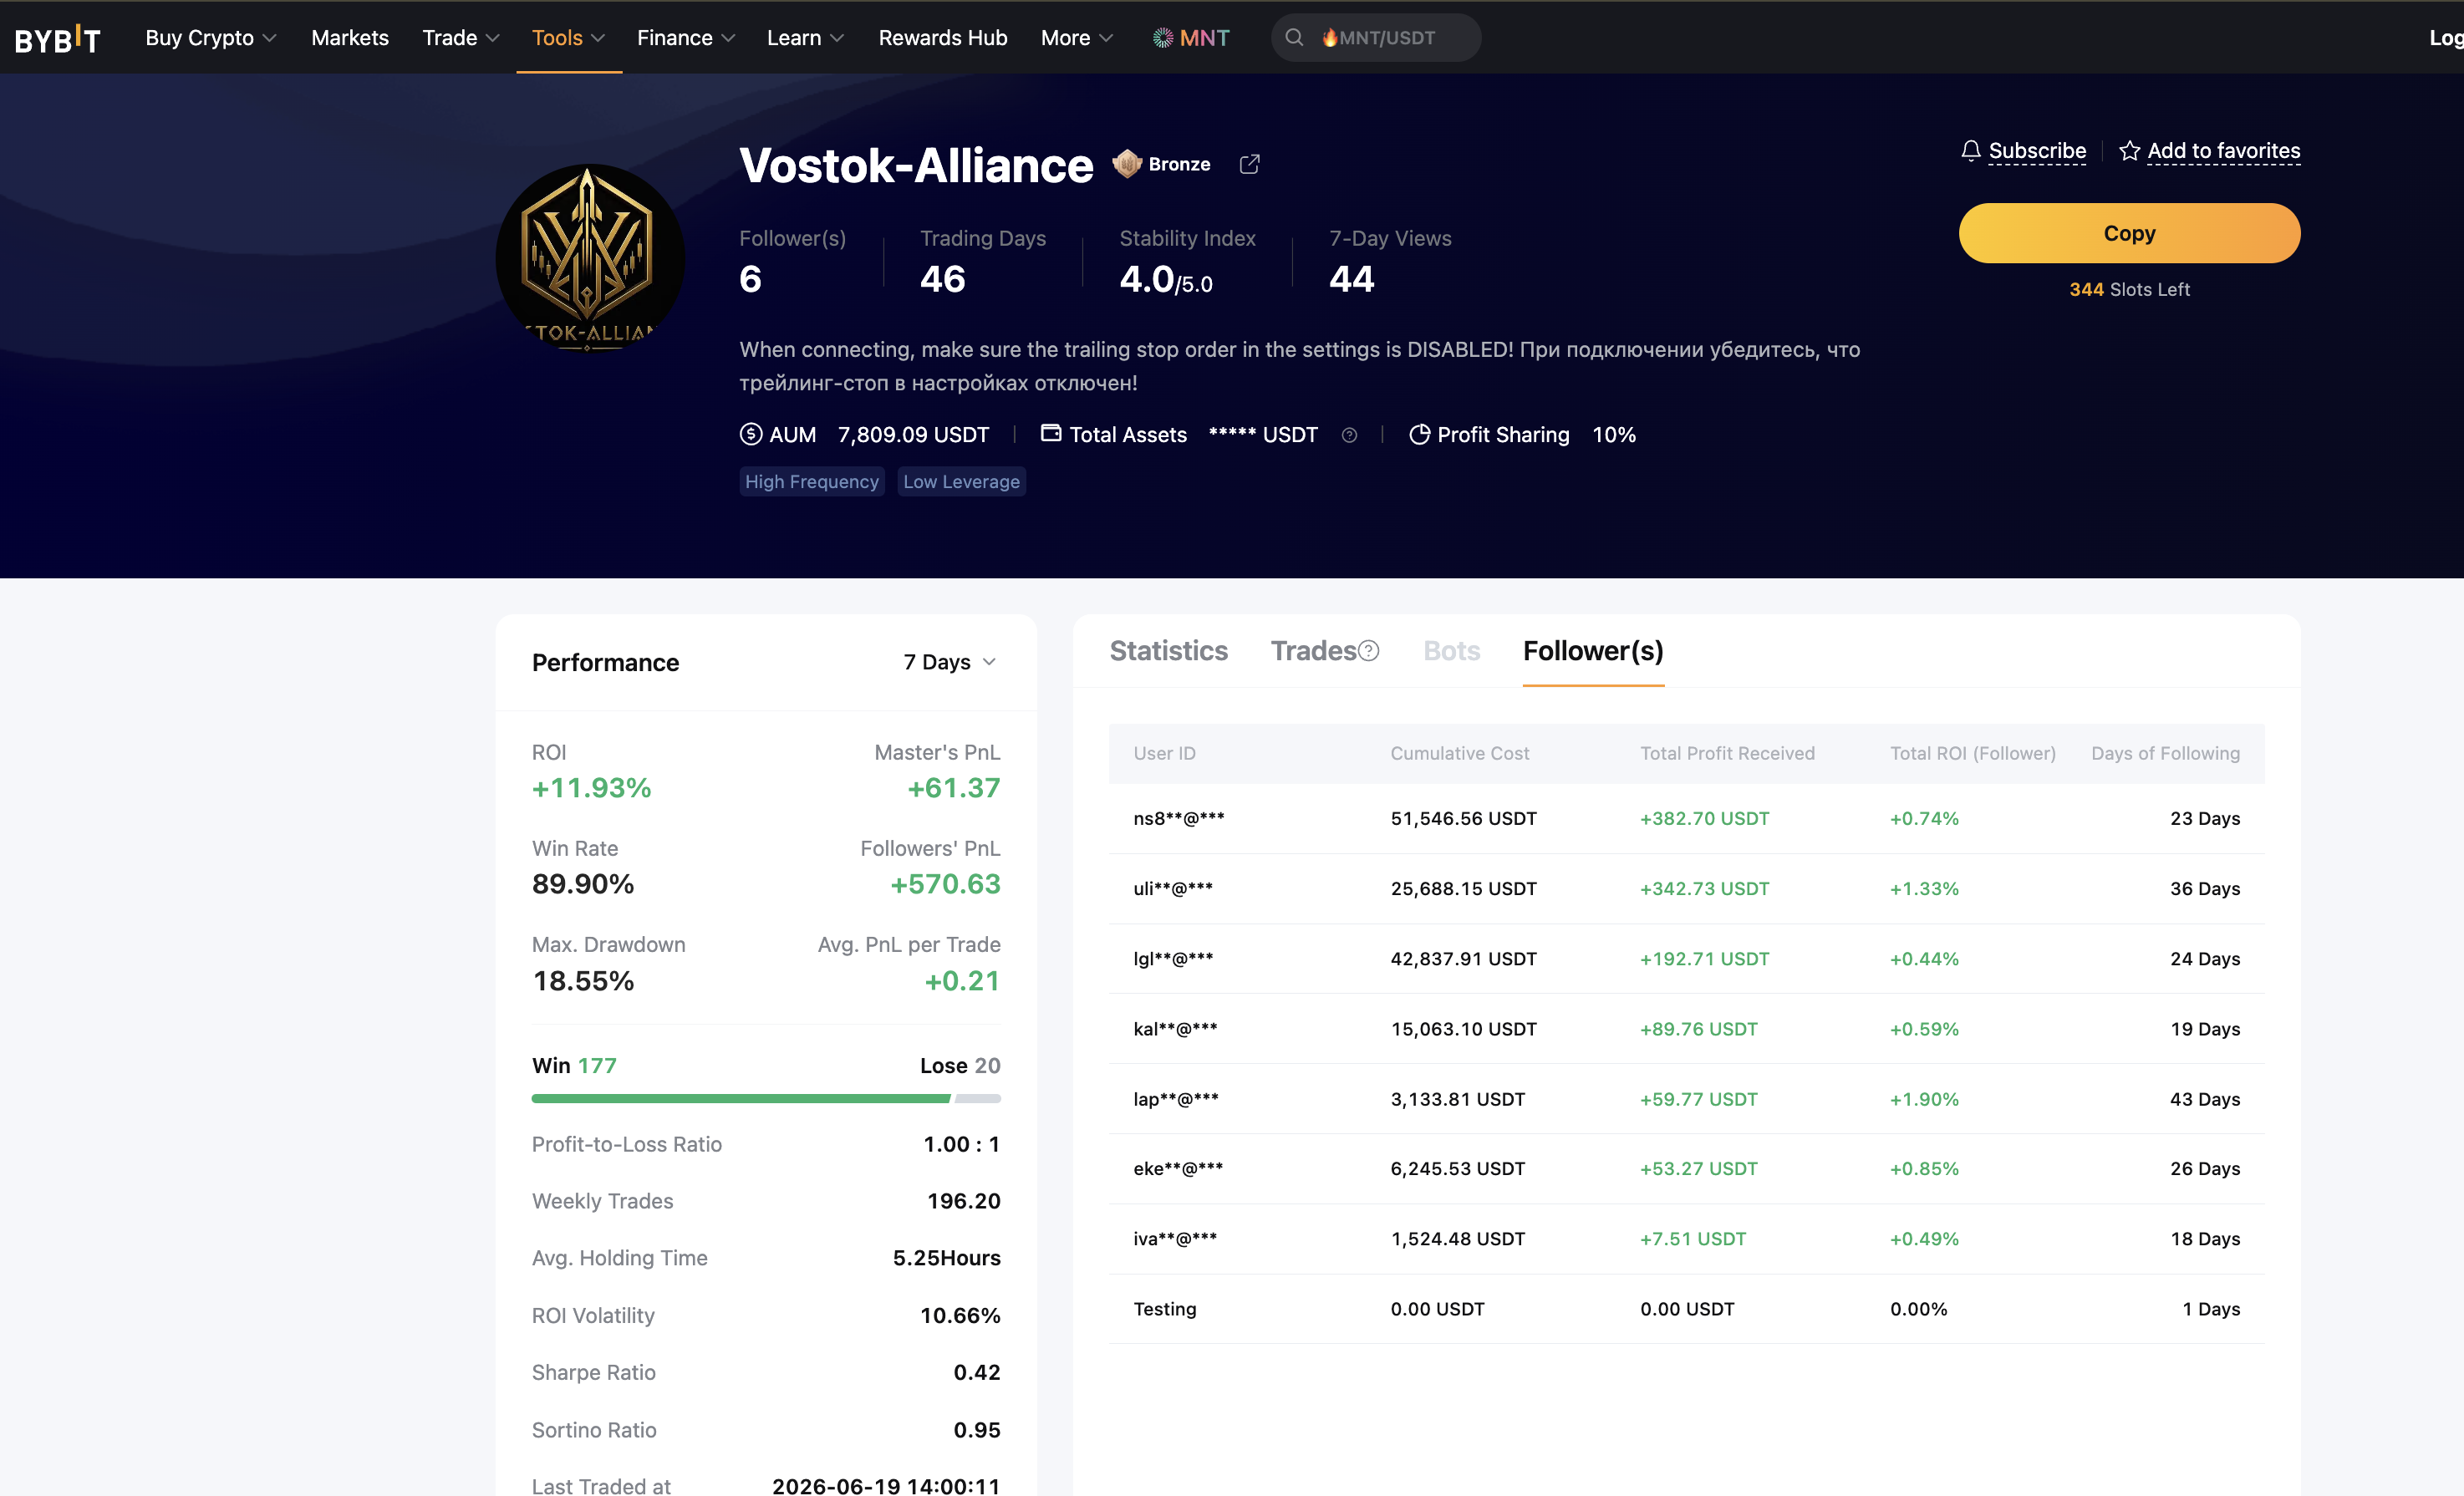
A view of the follower list showing individual profit, ROI, and days of following on our profile.
The checklist
Before copying any trader, run through this quick assessment:
- Is the track record longer than a couple of weeks?
- Is the max drawdown at a level you are personally comfortable sitting through?
- Is the last trade recent (proving the strategy is active)?
- Are the numbers verified on the exchange (not just screenshots)?
You can test this out by checking our numbers on Bybit and looking at each of these metrics in real time. Compare them to other leaders, verify the track record, and make your decision based on data, not hype.